How to Navigate
- Go to the Home Dashboard.
- From the left side panel, click on Logs.
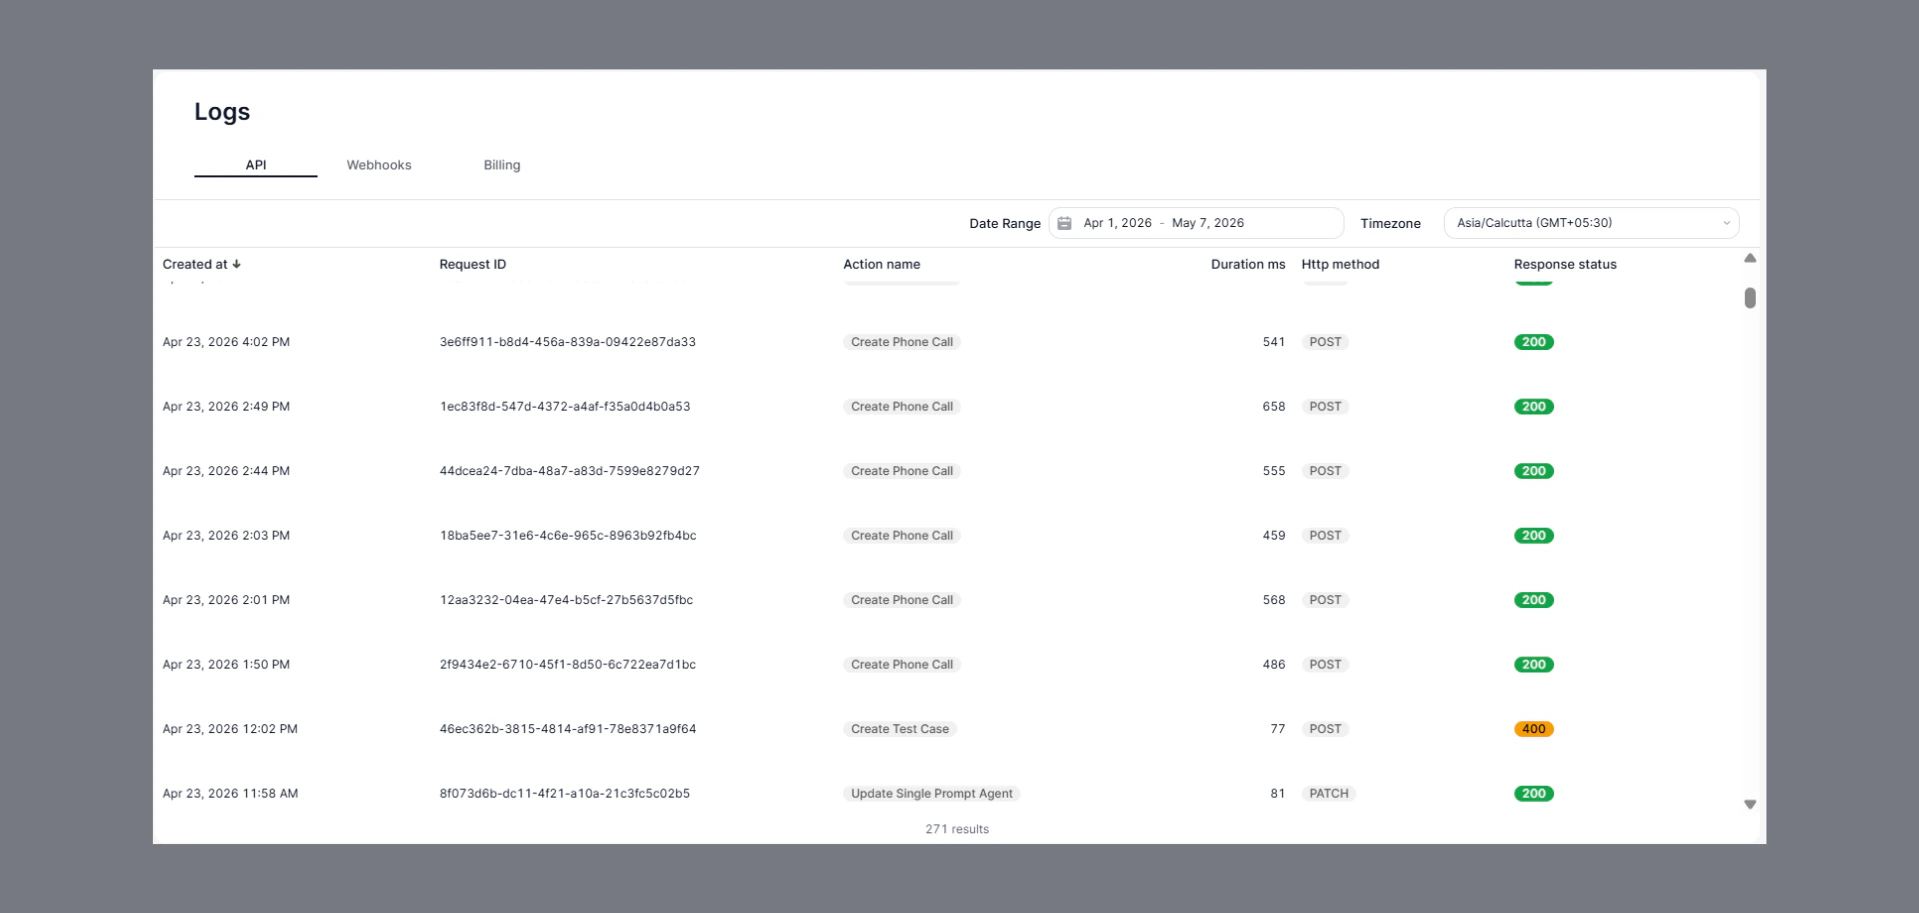
- Open the API tab at the top of the page.
Key Insights
- View all API request activities in one place.
- Track:
- Request ID
- Action name
- HTTP method
- Response status
- Request duration
- Identify successful and failed API requests quickly.
- Use date range and timezone filters for easier analysis.
Status Indicators
- 200 → Request completed successfully.
- 400 → Bad request or invalid input.
- Other non-200 responses indicate API or configuration issues.