How to Navigate
- Go to the Home Dashboard.
- From the left side panel, click on Logs.
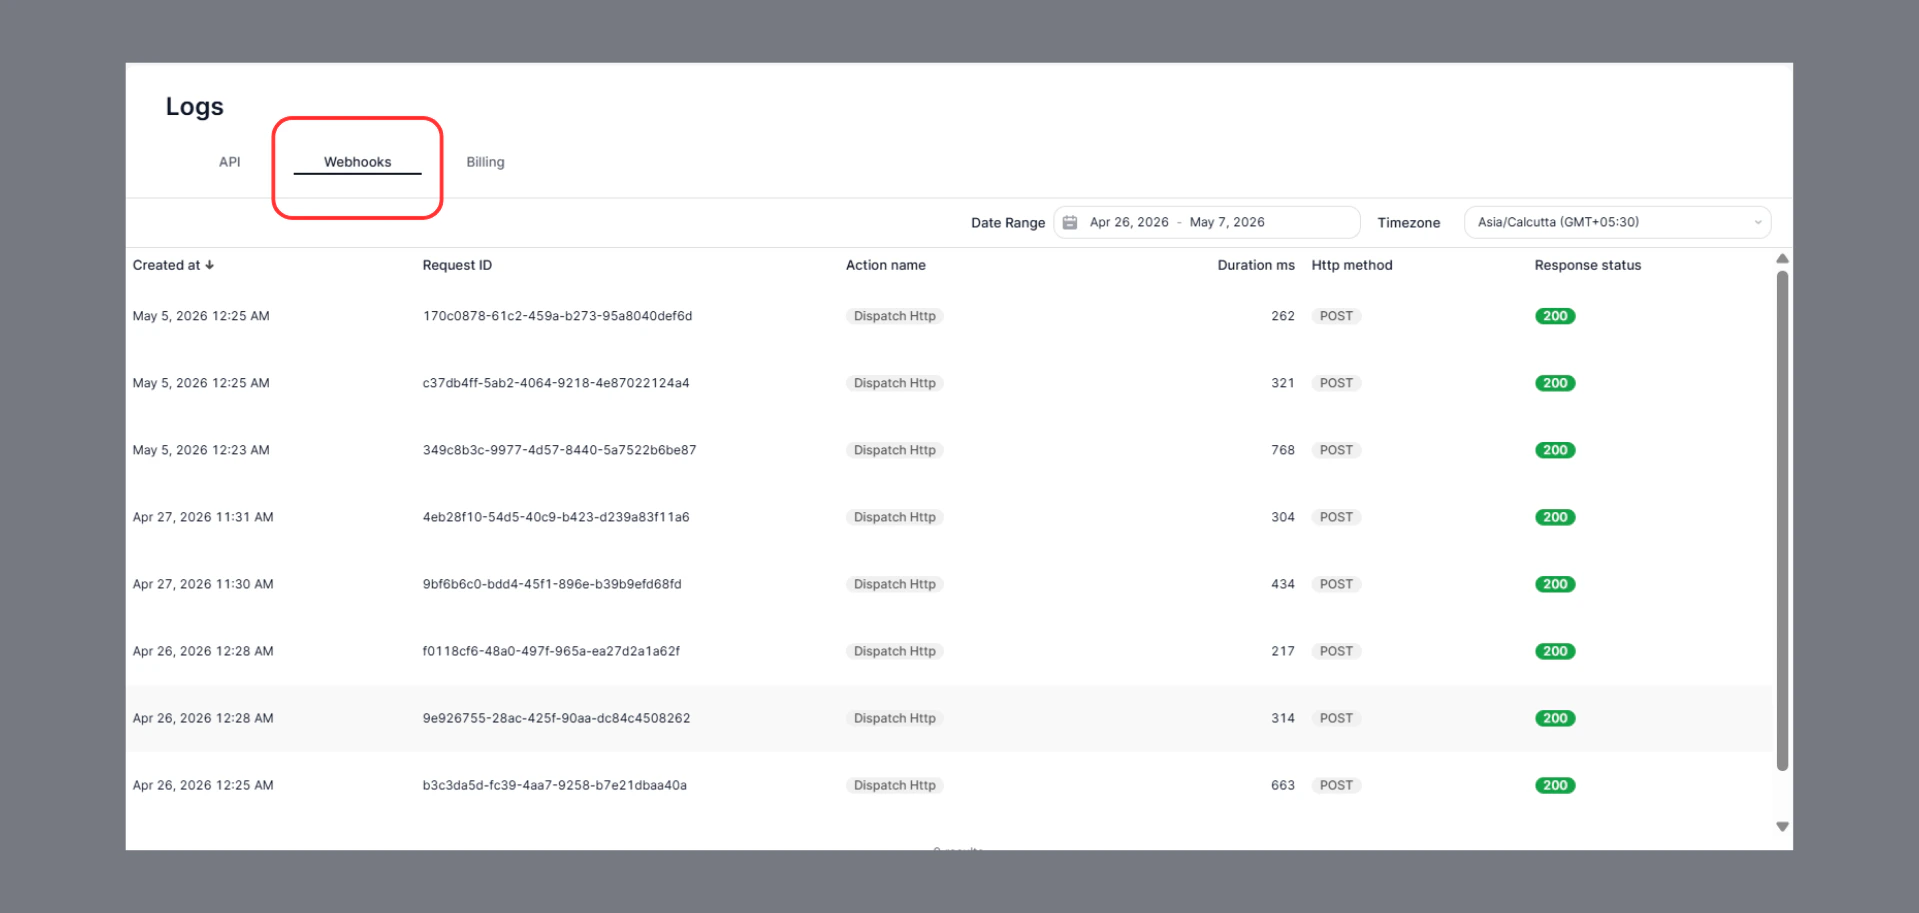
- Select the Webhooks tab at the top of the page.
Key Insights
- Track all outgoing webhook requests in real time.
- View request execution details such as:
- Request ID
- Action name
- HTTP method
- Duration
- Response status
- Quickly identify failed or delayed webhook calls.
- Filter logs using date range and timezone for easier troubleshooting.
Common Use Cases
- Verify whether a webhook was successfully delivered.
- Debug integration issues with external services.
- Monitor webhook response times and reliability.
- Audit historical webhook activity.
Status Indicators
- 200 → Request completed successfully.
- Failed or non-200 responses indicate delivery or integration issues requiring attention.