> ## Documentation Index
> Fetch the complete documentation index at: https://docs.sigmamind.ai/llms.txt
> Use this file to discover all available pages before exploring further.
# Call Analytics
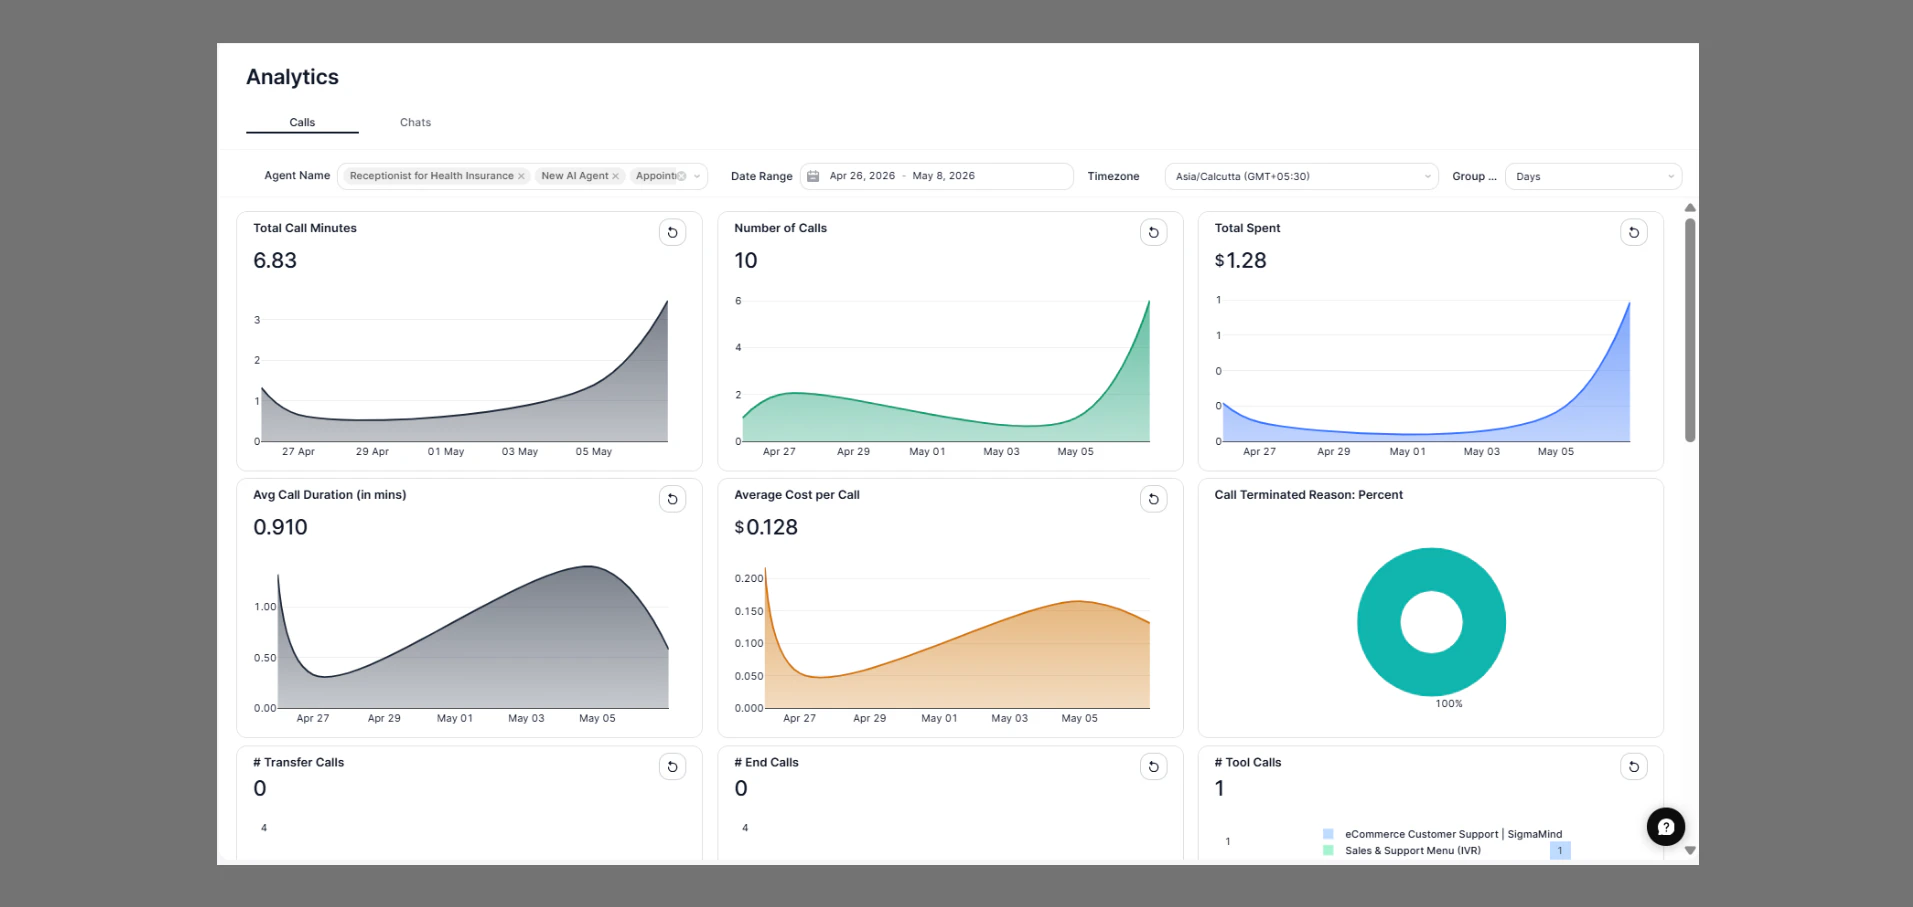
The **Call Analytics** dashboard gives you a real-time view of how your AI voice agents are performing, from call volume and duration to cost breakdowns and quality scores.
Analytics are scoped to the agents and date range selected in the filter bar. Use the **Agent Name**, **Date Range**, and **Timezone** controls at the top of the page to customize your view.
 ***
## Key Metrics
Cumulative talk time across all selected agents and the chosen date range.
Total calls handled. Use this alongside **Avg Call Duration** to understand traffic patterns.
All-in cost including LLM inference, telephony, TTS, STT, and platform fees.
Mean duration per call in minutes. A falling average on a high-volume day is normal and expected.
Total spend divided by number of calls. Useful for budgeting and capacity planning.
Breakdown (count and %) of how calls ended — caller hang-up, agent end, or transfer.
***
## Volume & Cost Trends
Each metric card on the dashboard includes a **time-series chart** grouped by the interval you select (Hours, Days, Weeks). These charts help you spot:
| Pattern | What it means |
| ----------------------------------------- | ------------------------------------------- |
| Flat volume → sudden spike | Testing session or new user on-boarding |
| Rising avg duration early → falling later | Power users first, focused callers later |
| Cost closely tracks volume | Healthy — no runaway per-call cost |
| Cost rising faster than volume | Investigate LLM prompt length or model tier |
Switch **Group By** to **Hours** when investigating a specific day's spike — it shows exactly when traffic arrived.
***
## Agent Activity
### Tool Calls
The **# Tool Calls** chart shows how often agents invoked external tools (e.g. CRM look-ups, appointment booking APIs) during calls. The **% Tool Calls (weighted)** metric normalises this against total call volume.
A very low tool-call rate for agents designed to use tools may indicate missing intent triggers or misconfigured tool definitions. Review your agent's tool configuration if the weighted rate is unexpectedly low.
### Transfer & End Calls
| Metric | Description |
| ------------------------------- | ----------------------------------------------------------------------------------------- |
| **# Transfer Calls** | Calls escalated to a live agent. A non-zero value means your fallback routing is working. |
| **# End Calls** | Calls the agent actively ended (as opposed to the caller hanging up). |
| **% Transfer Calls (weighted)** | Transfer rate as a share of all calls — key self-service KPI. |
***
## Call Quality
### Blank Calls
The **% of Blank Calls** chart shows the percentage of calls with no meaningful audio or interaction per day. High blank-call rates are normal during testing phases but should fall toward 0% in production.
### Quality by Duration
The **Call Quality (% of call b/w duration)** stacked bar chart segments calls into duration buckets — longer calls generally indicate higher engagement and are treated as higher quality.
During ramp-up or heavy test days, you may see 100% of calls fall into shorter duration buckets. This is expected and will normalize as real traffic grows.
***
## Cost Breakdown
The **Cost Breakdown** chart splits spend into five components:
The largest cost driver for most agents. Directly influenced by system prompt length, conversation turns, and the model tier selected in your agent configuration.
Per-minute carrier charges for inbound or outbound calls. Fixed rate regardless of agent behaviour.
Charged per character synthesised. Shorter, more concise agent responses reduce TTS cost.
Per-second transcription cost. Longer silences and hold periods are included in billable STT time.
Fixed SigmaMind infrastructure overhead per call.
***
## Call Source
The **Call Source** donut shows where calls originated:
| Source | Description |
| ---------------- | ------------------------------------------------------- |
| **Playground** | Calls made via the SigmaMind in-browser testing sandbox |
| **Web Widget** | Calls initiated from an embedded widget on your website |
| **Phone Number** | Calls from a provisioned SigmaMind phone number |
| **API** | Programmatically triggered calls via the Calls API |
Use the **↺ refresh icon** on individual charts to reload that metric without refreshing the full page.
***
## Key Metrics
Cumulative talk time across all selected agents and the chosen date range.
Total calls handled. Use this alongside **Avg Call Duration** to understand traffic patterns.
All-in cost including LLM inference, telephony, TTS, STT, and platform fees.
Mean duration per call in minutes. A falling average on a high-volume day is normal and expected.
Total spend divided by number of calls. Useful for budgeting and capacity planning.
Breakdown (count and %) of how calls ended — caller hang-up, agent end, or transfer.
***
## Volume & Cost Trends
Each metric card on the dashboard includes a **time-series chart** grouped by the interval you select (Hours, Days, Weeks). These charts help you spot:
| Pattern | What it means |
| ----------------------------------------- | ------------------------------------------- |
| Flat volume → sudden spike | Testing session or new user on-boarding |
| Rising avg duration early → falling later | Power users first, focused callers later |
| Cost closely tracks volume | Healthy — no runaway per-call cost |
| Cost rising faster than volume | Investigate LLM prompt length or model tier |
Switch **Group By** to **Hours** when investigating a specific day's spike — it shows exactly when traffic arrived.
***
## Agent Activity
### Tool Calls
The **# Tool Calls** chart shows how often agents invoked external tools (e.g. CRM look-ups, appointment booking APIs) during calls. The **% Tool Calls (weighted)** metric normalises this against total call volume.
A very low tool-call rate for agents designed to use tools may indicate missing intent triggers or misconfigured tool definitions. Review your agent's tool configuration if the weighted rate is unexpectedly low.
### Transfer & End Calls
| Metric | Description |
| ------------------------------- | ----------------------------------------------------------------------------------------- |
| **# Transfer Calls** | Calls escalated to a live agent. A non-zero value means your fallback routing is working. |
| **# End Calls** | Calls the agent actively ended (as opposed to the caller hanging up). |
| **% Transfer Calls (weighted)** | Transfer rate as a share of all calls — key self-service KPI. |
***
## Call Quality
### Blank Calls
The **% of Blank Calls** chart shows the percentage of calls with no meaningful audio or interaction per day. High blank-call rates are normal during testing phases but should fall toward 0% in production.
### Quality by Duration
The **Call Quality (% of call b/w duration)** stacked bar chart segments calls into duration buckets — longer calls generally indicate higher engagement and are treated as higher quality.
During ramp-up or heavy test days, you may see 100% of calls fall into shorter duration buckets. This is expected and will normalize as real traffic grows.
***
## Cost Breakdown
The **Cost Breakdown** chart splits spend into five components:
The largest cost driver for most agents. Directly influenced by system prompt length, conversation turns, and the model tier selected in your agent configuration.
Per-minute carrier charges for inbound or outbound calls. Fixed rate regardless of agent behaviour.
Charged per character synthesised. Shorter, more concise agent responses reduce TTS cost.
Per-second transcription cost. Longer silences and hold periods are included in billable STT time.
Fixed SigmaMind infrastructure overhead per call.
***
## Call Source
The **Call Source** donut shows where calls originated:
| Source | Description |
| ---------------- | ------------------------------------------------------- |
| **Playground** | Calls made via the SigmaMind in-browser testing sandbox |
| **Web Widget** | Calls initiated from an embedded widget on your website |
| **Phone Number** | Calls from a provisioned SigmaMind phone number |
| **API** | Programmatically triggered calls via the Calls API |
Use the **↺ refresh icon** on individual charts to reload that metric without refreshing the full page.